Site: wordpressspeedoptimizationservice.com Platform: WordPress
Before we optimize a client’s site, we hold our own to the same standard — audited with the exact same tools we use to report results back to clients. No synthetic-only shortcuts, no cherry-picked runs. Here’s what our own site scores today.
The Results
| Test | Metric | Result |
|---|---|---|
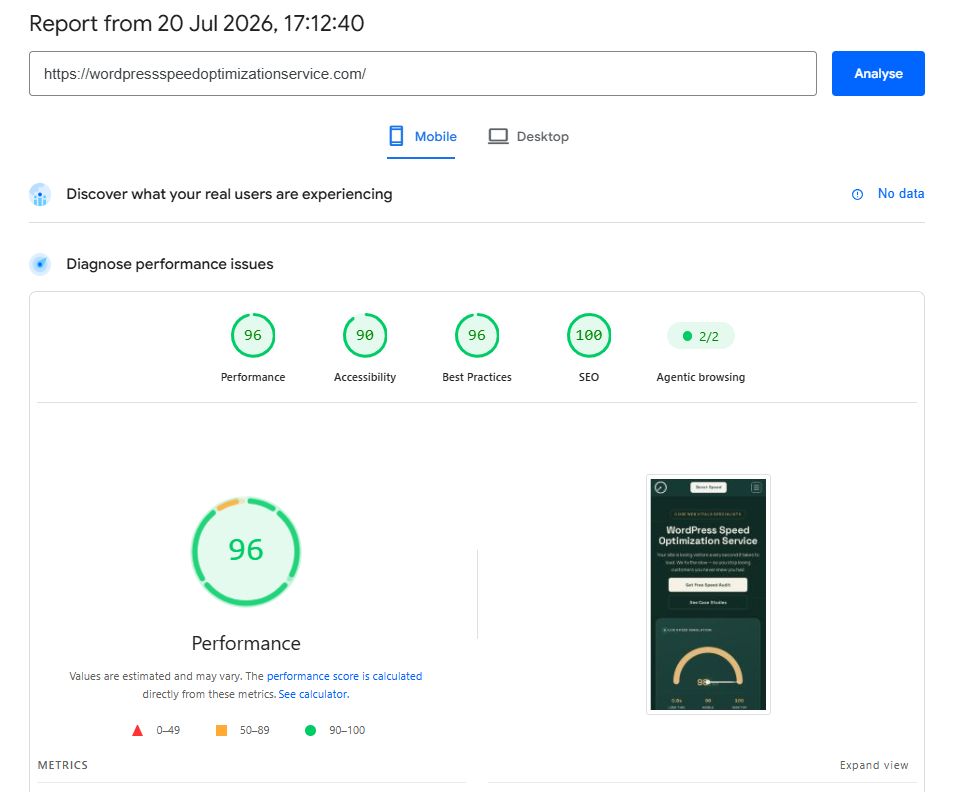
| PageSpeed Insights (Mobile) | Performance | 96/100 |
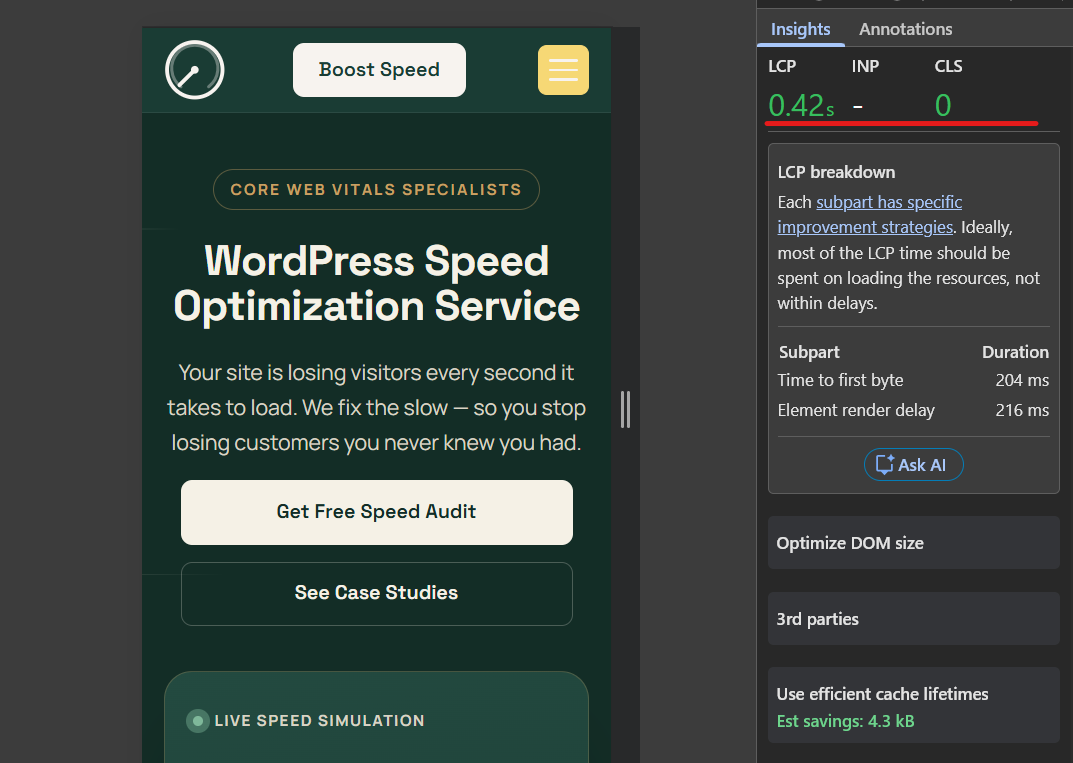
| PageSpeed Insights (Mobile) | Largest Contentful Paint | 0.42s |
| PageSpeed Insights (Mobile) | Cumulative Layout Shift | 0 |
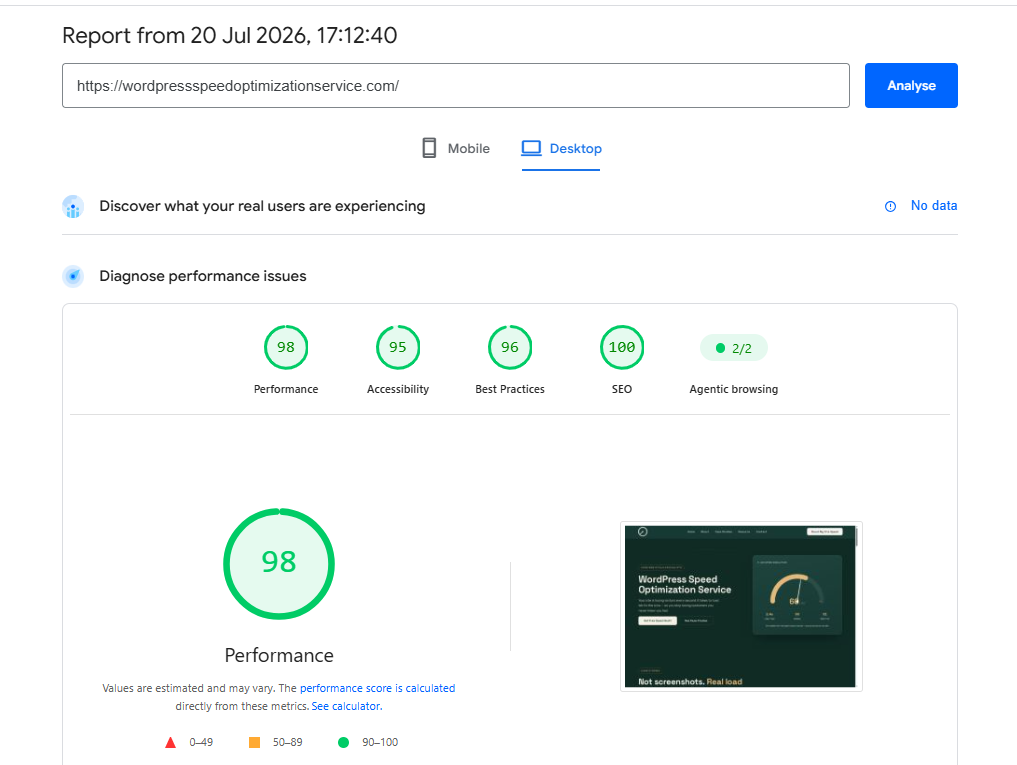
| PageSpeed Insights (Desktop) | Performance | 98/100 |
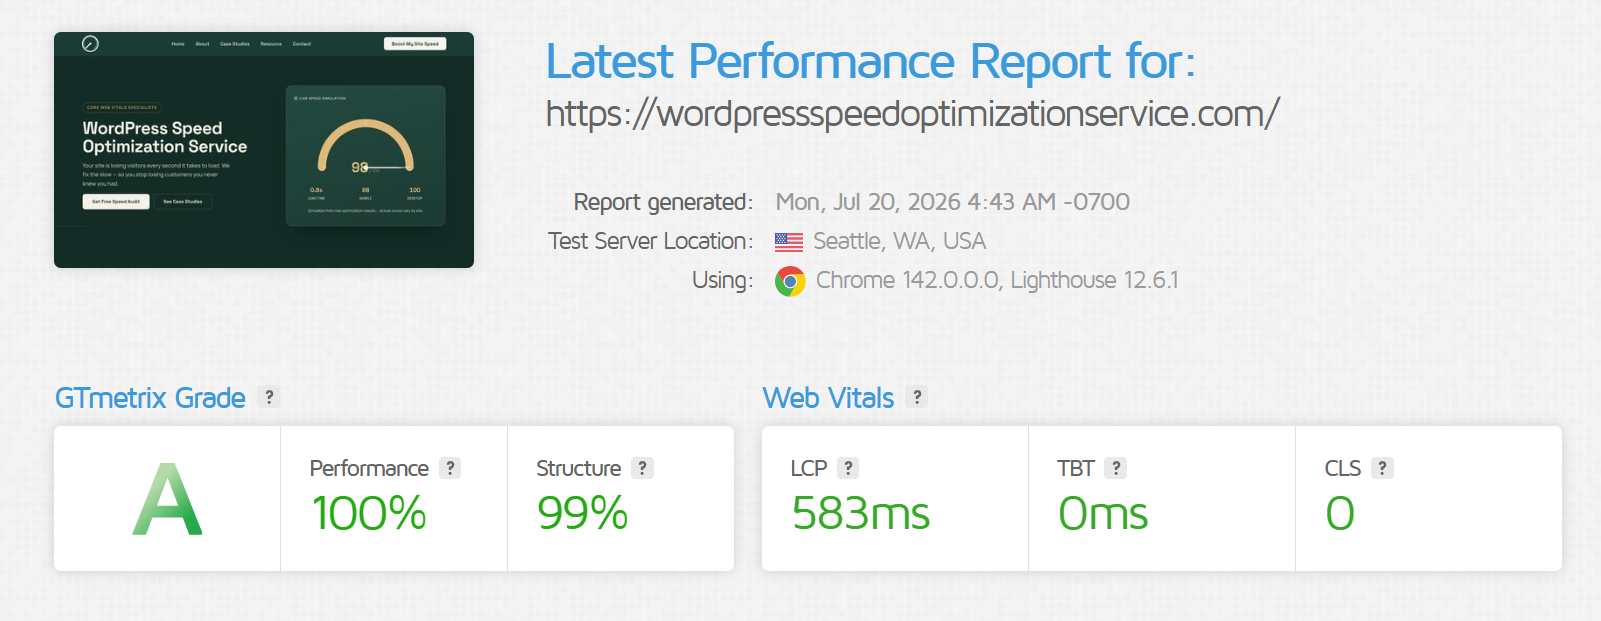
| GTmetrix | Grade | A |
| GTmetrix | Performance / Structure | 100% / 99% |
| GTmetrix | Largest Contentful Paint | 583ms |
| GTmetrix | Total Blocking Time | 0ms |
| GTmetrix | Cumulative Layout Shift | 0 |
A closer look at the PageSpeed LCP breakdown tells the real story: of the 0.42s total, 204ms was time-to-first-byte and 216ms was element render delay — meaning almost the entire load time was spent on legitimate server response and rendering, with essentially no wasted time sitting in queues, redirects, or render-blocking scripts. That’s the signature of a site that’s been properly tuned end to end, not one that just looks good on a single test run.
Why We’re Showing You This
It’s easy for any agency to claim “we make sites fast.” It’s harder to point to a live, public site — one you can test yourself right now in PageSpeed Insights or GTmetrix — and say “this is what our work actually produces.” That’s the point of this page. Run the tests yourself. The numbers above aren’t projections or lab estimates pulled from a sales page; they’re the same live scores you’d get testing the URL today.
How We Approach It
The methodology behind these numbers is the same one we apply to every client site:
- Caching and delivery tuned together, not layered as separate, competing systems
- Images served in modern, efficient formats, with the hero/LCP image deliberately excluded from lazy-loading — a detail that’s easy to get wrong and directly hurts LCP when missed
- Fonts preloaded, not left to load late and cause layout shift or invisible text
- JavaScript deferred and assets minified, kept simple rather than over-engineered with aggressive execution-delay tricks that often break functionality
- Server response time treated as a first-class metric — front-end tuning can only do so much if the hosting stack itself is slow
- Database and back-end housekeeping automated, so performance doesn’t quietly degrade over time
None of this is exotic. It’s disciplined, correctly-configured fundamentals — applied consistently, and verified with the same tools we hand back to clients in their reports.
Worth being upfront about: every website is different. Your theme, plugins, content, hosting, and traffic all shape what’s realistic for your site — so we’re not promising these exact numbers for every project. What we do promise is the same disciplined process behind them, applied to your specific setup.
One honest caveat: this site is brand new — domain registered July 10, live as of today. That means you won’t find real-user (Chrome UX Report / CrUX) field data for it yet; that data only populates after roughly 28 days of real traffic. Everything above is lab data from PageSpeed Insights and GTmetrix, which is exactly what it should be for a site this young — and it’s the same standard we hold every client build to from day one.
This is a live audit of our own production site, tested with PageSpeed Insights and GTmetrix — the same tools we use to measure every client’s before-and-after results.
Images Proof