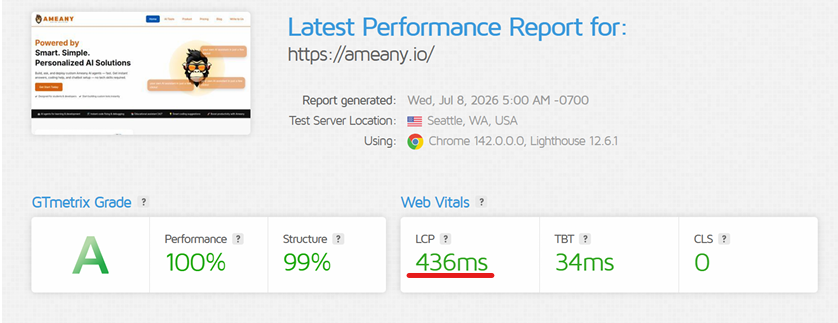
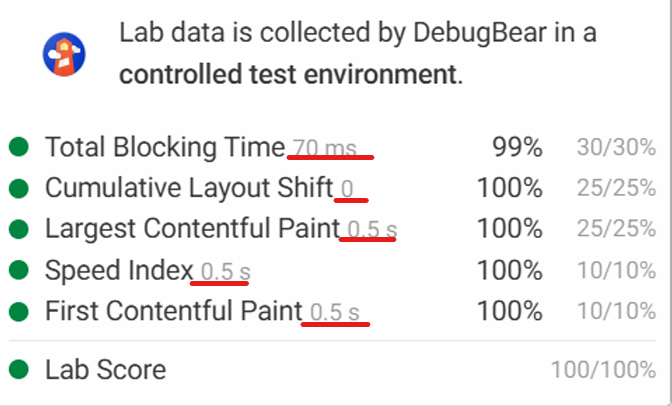
Ameany.io is an AI tools platform built on WordPress. On paper, synthetic speed tests looked fine — but real visitors opening the site were waiting on a slow server response before the page even started rendering. That gap between “lab score” and “what a real person feels” is exactly what we went after.
The Problem
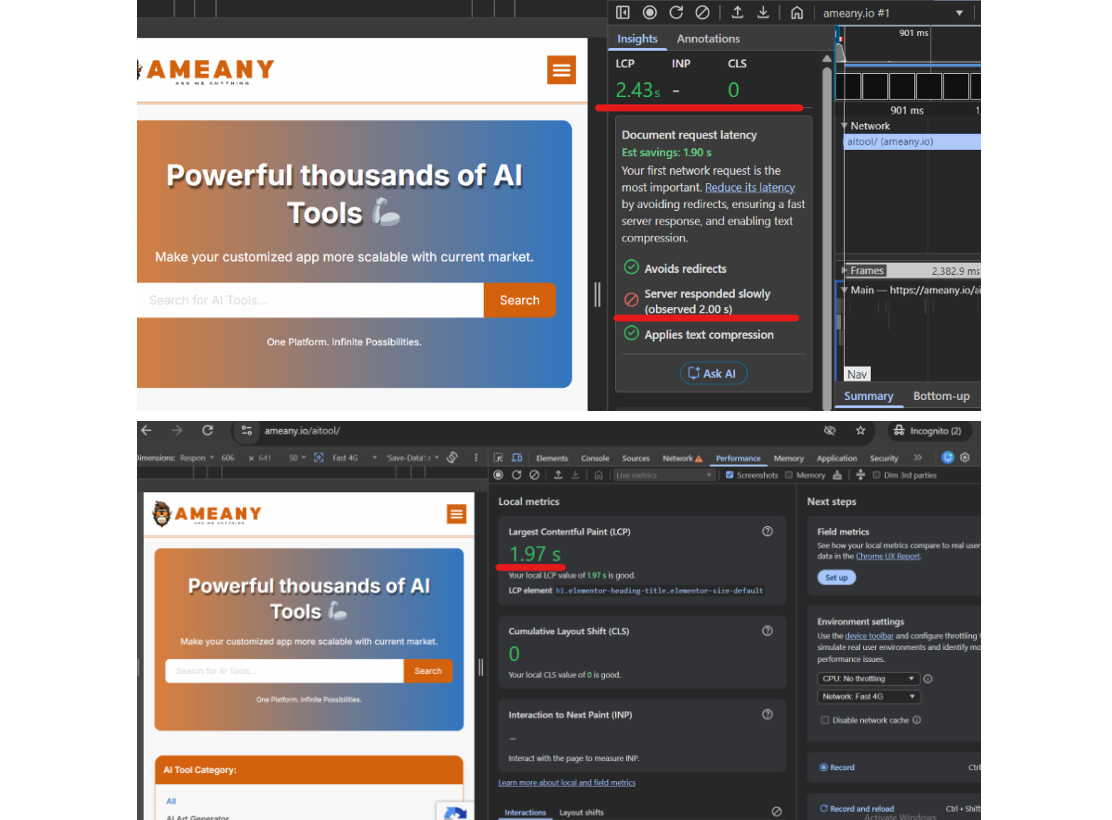
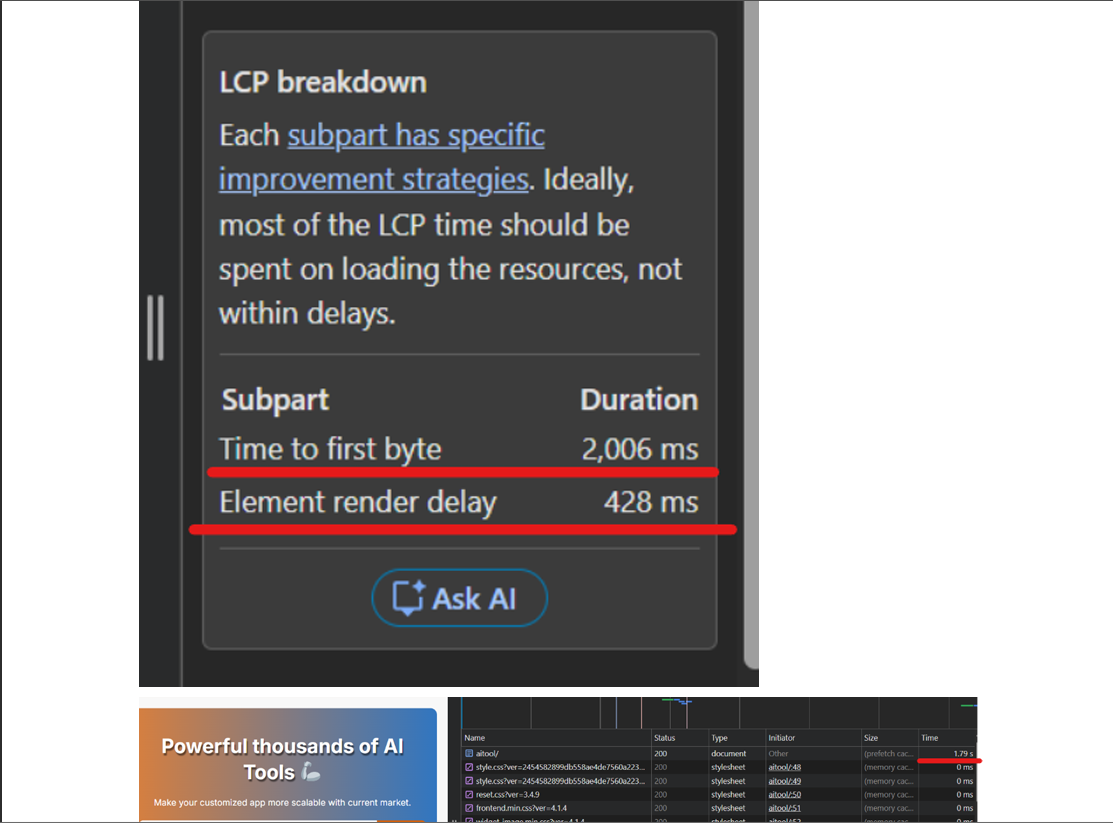
We don’t rely on lab scores alone, because they don’t always match what a real visitor experiences. So we tested the site the way an actual visitor would — using Chrome DevTools on a live browser session. That test showed the real issue: Time to First Byte was sitting at 2,006 milliseconds — meaning the server took over 2 full seconds just to start responding, before any content could even begin loading.
What We Did
- Set up full-page caching through Cloudflare and FlyingPress, so pages are served instantly instead of being generated by the server on every visit
- Enabled edge caching so requests get answered from a server near the visitor
- Compressed and optimized images
- Minified CSS and JS, and cleaned up render-blocking requests
- Preloaded key fonts and resources to remove delay before content appears
The Results
Real Visitor Browser Test (Chrome DevTools) — this measures what an actual visitor experiences when they open the site, not a lab simulation.
| Metric | Before | After |
|---|---|---|
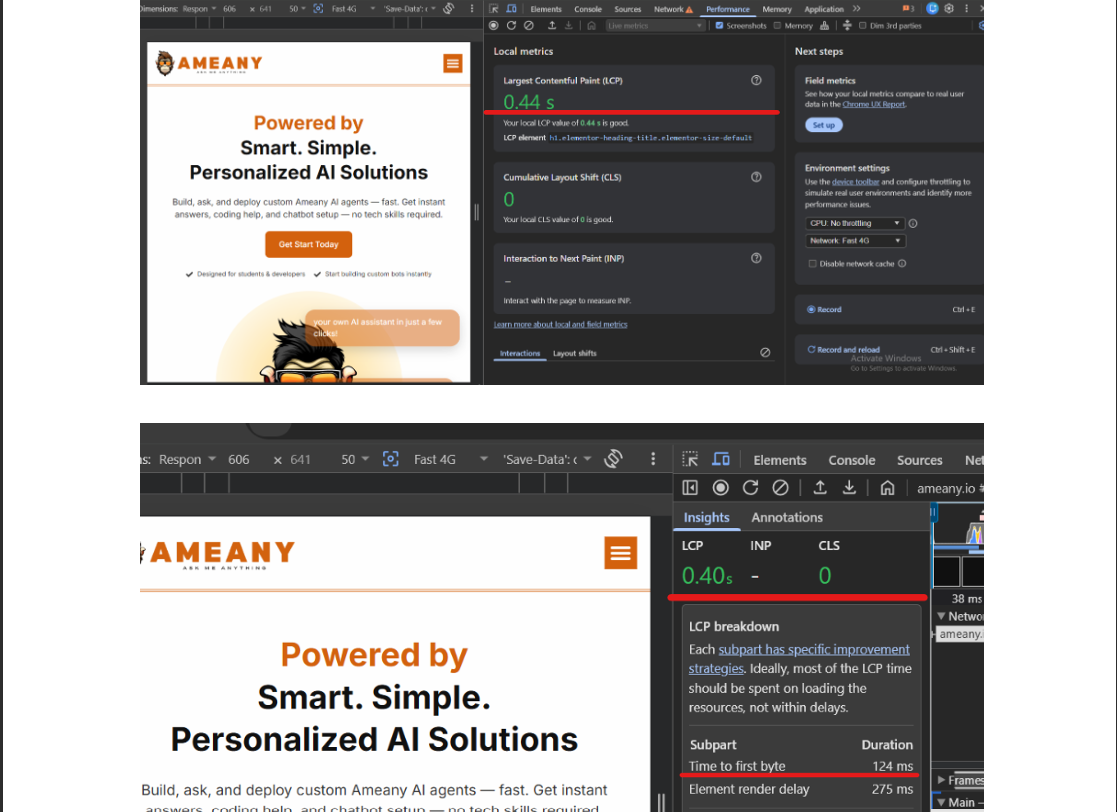
| TTFB (Time to First Byte) | 2,006ms | 124ms |
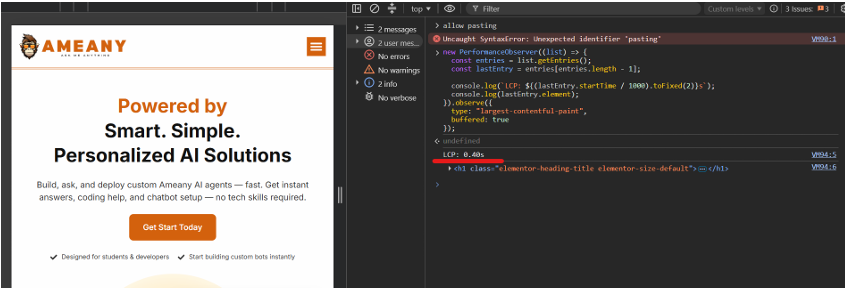
| LCP (Largest Contentful Paint) | 1.97s | 0.40s |
| Element Render Delay | 428ms | 275ms |
| CLS (Cumulative Layout Shift) | 0 | 0 |
| Document Load (cached) | 1.79s | ~196ms |
Key win: server response time dropped from 2,006ms to 124ms — a 94% reduction. That was the single biggest thing slowing down every visitor, on every page load.
Why This Matters
A site can score well on a lab test and still feel slow to real people — server response time is often the hidden bottleneck that lab scores don’t fully expose. This is exactly why we test with real browser sessions, not just automated scores. Fixing the server response time here made every single page on the site faster, not just the homepage.
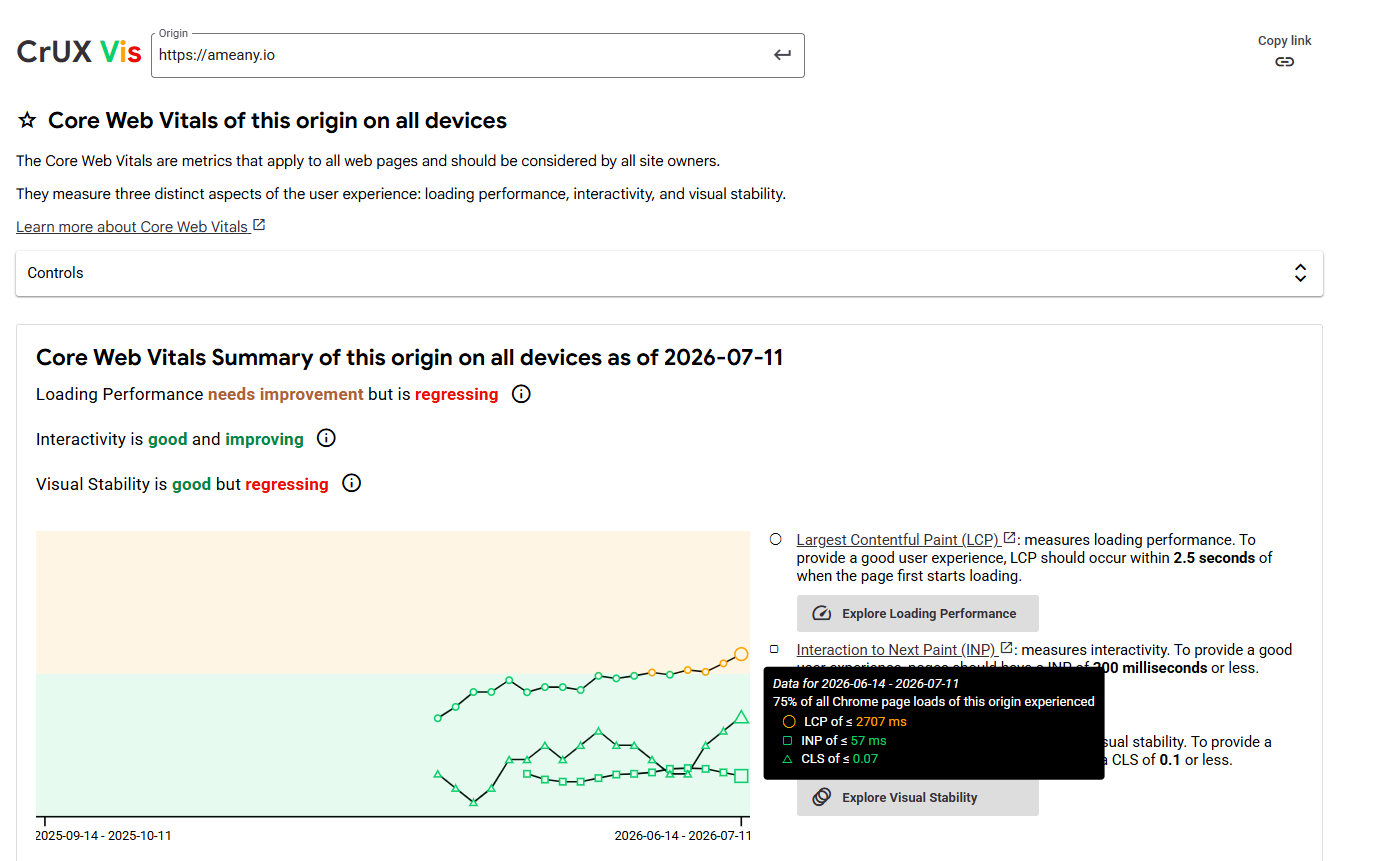
Before Optimization (CrUX Data)
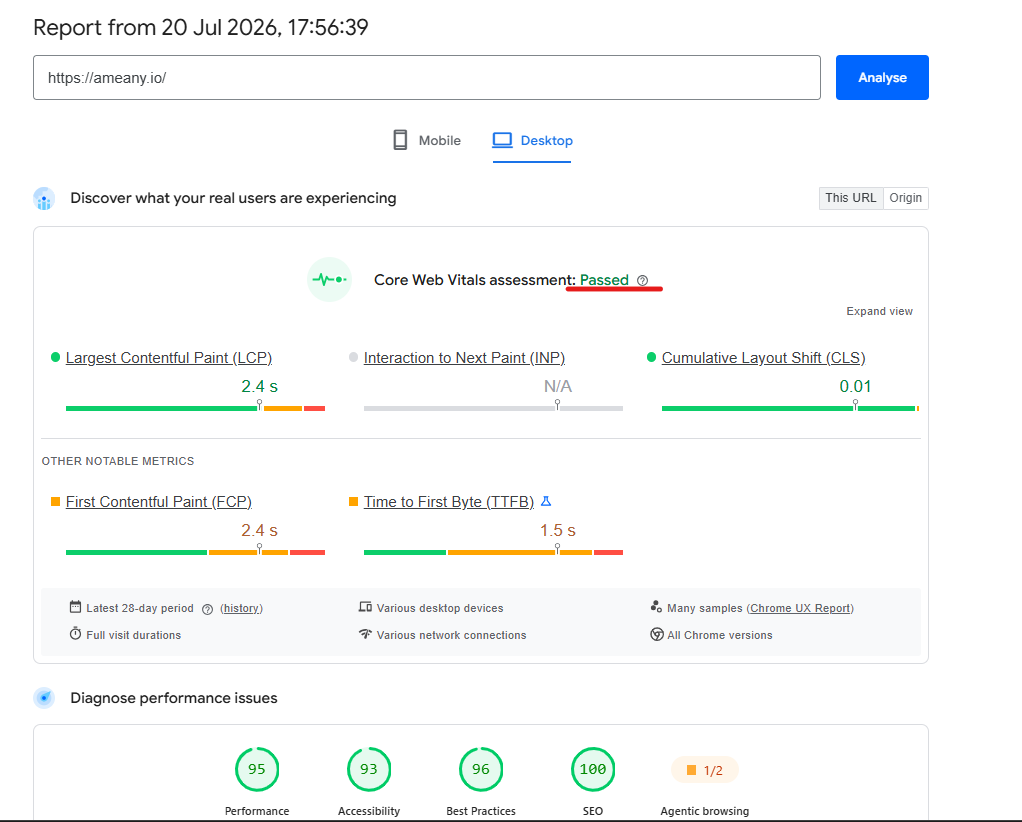
After Optimization
Before Optimization (Chrome DevTools Data)
After Optimization (Chrome DevTools Data)
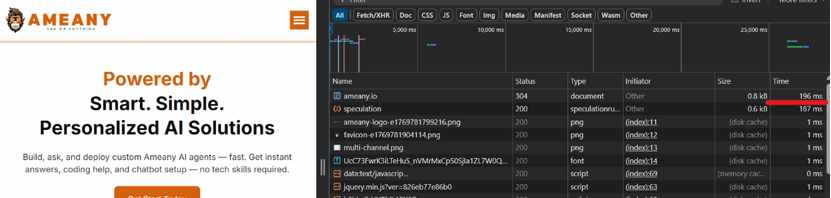
Before Optimization (Tool Data)
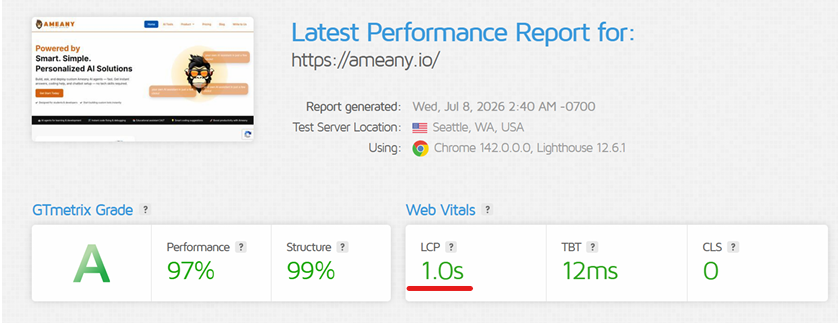
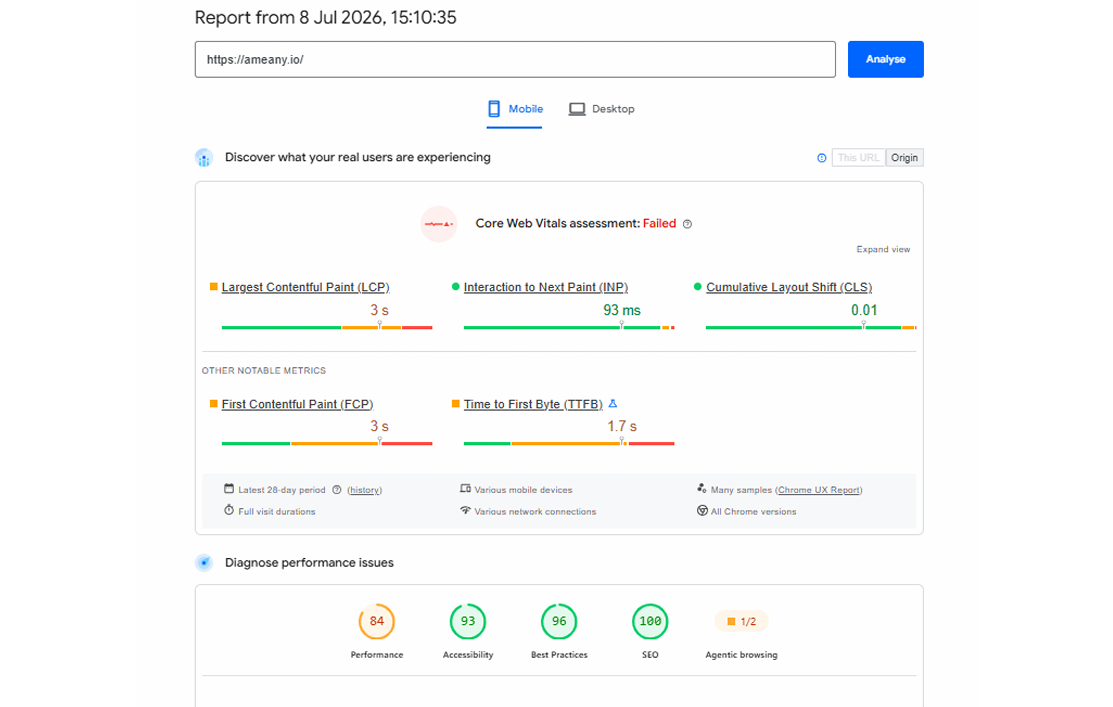
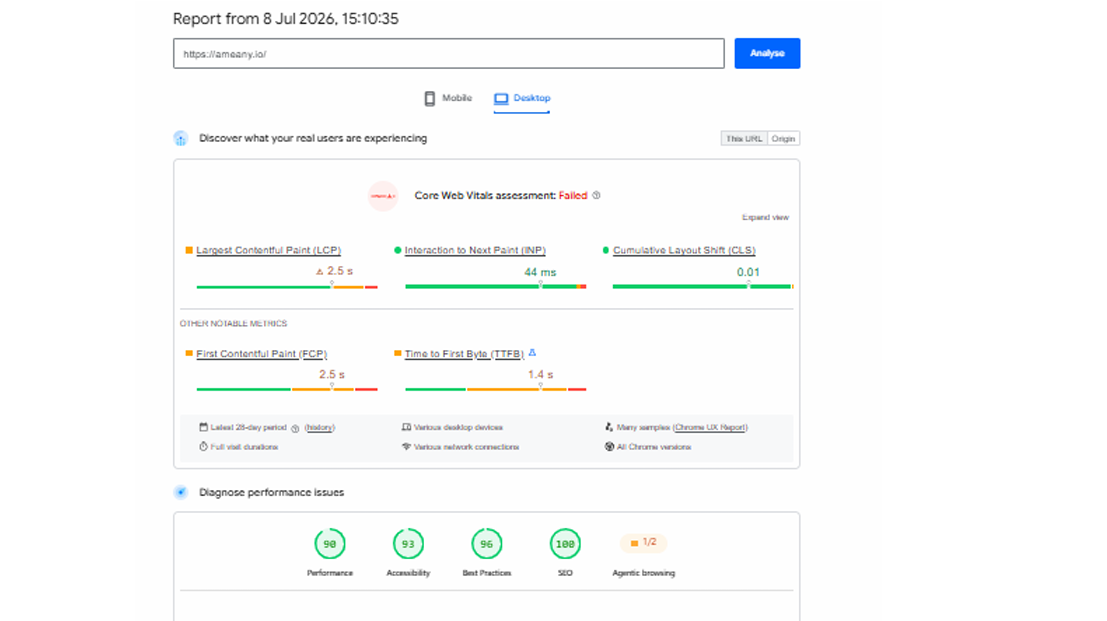
After Optimization (Tool Data)