MonkeyLinks.io is a link building agency’s website, built on WordPress. Like most agency sites, it depends on visitors staying long enough to see the offer and fill the form. A slow site was working against that every single day.
The Problem
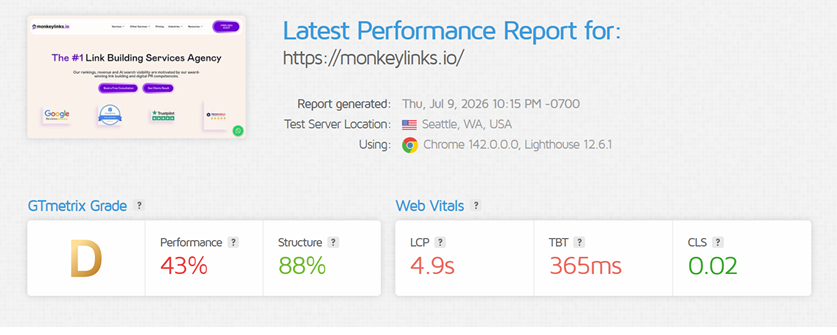
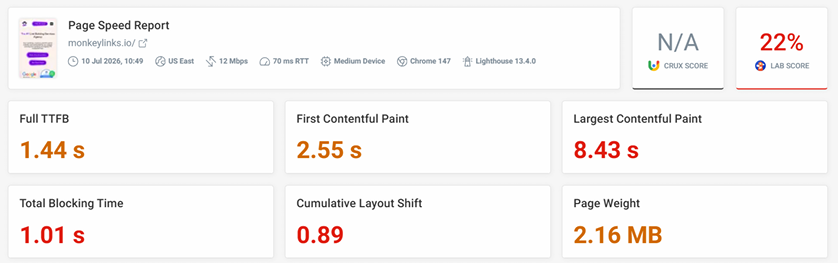
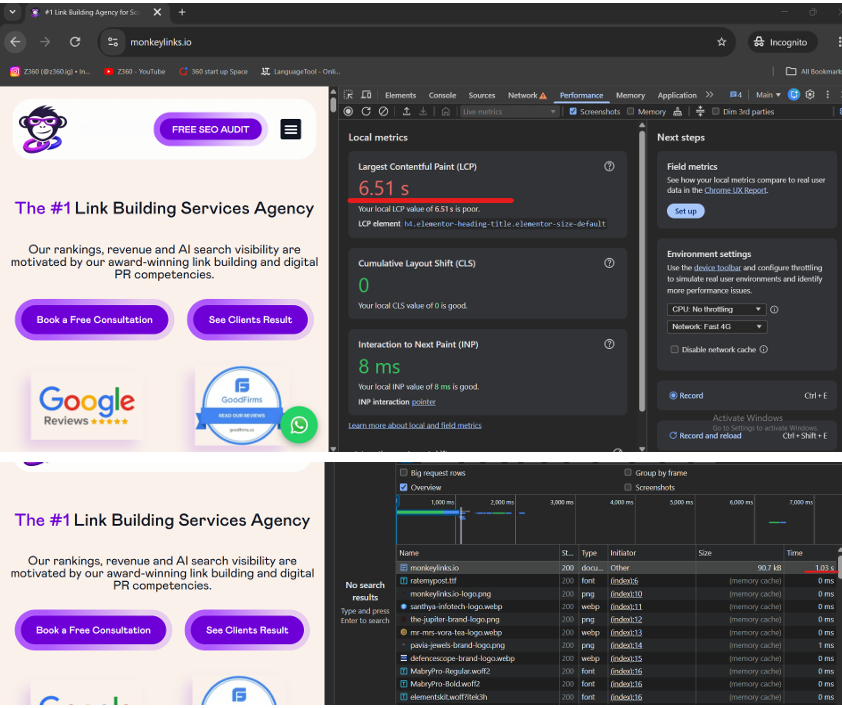
The site was slow on both mobile and desktop, and it was failing Core Web Vitals — the metrics Google itself uses to judge how a real visitor experiences a page. GTmetrix graded the homepage a D, with a performance score of just 43%. Largest Contentful Paint was sitting at 4.9 seconds, which is nearly double what Google considers acceptable.
What We Did
- Connected the site to Cloudflare and turned on edge caching, so pages get served from a server near the visitor instead of one single hosting location
- Installed and configured FlyingPress for page caching, CSS/JS minification, and combining files
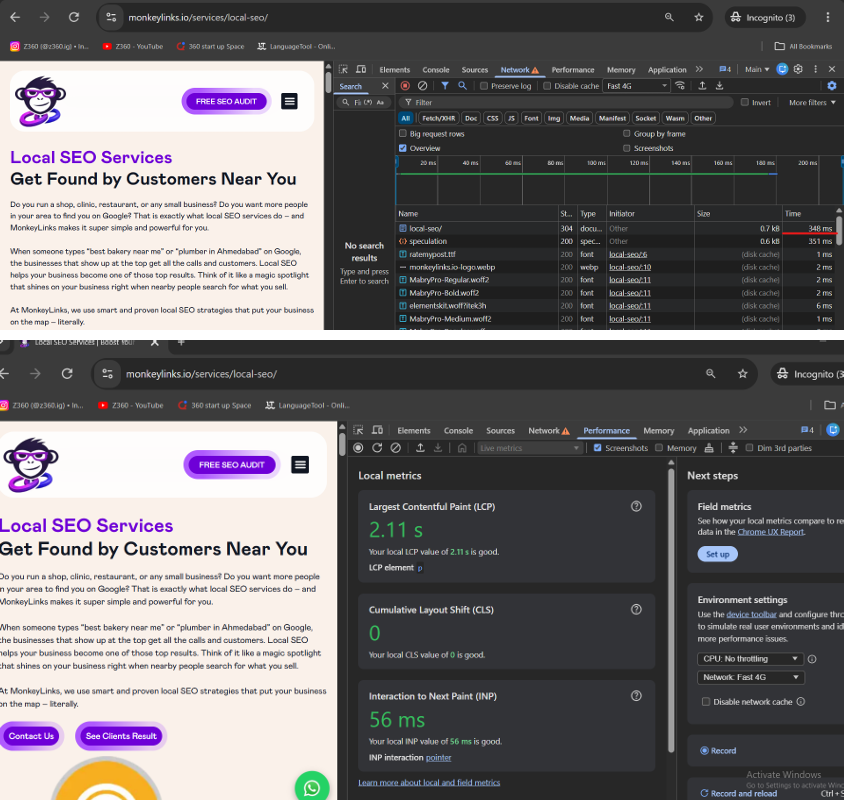
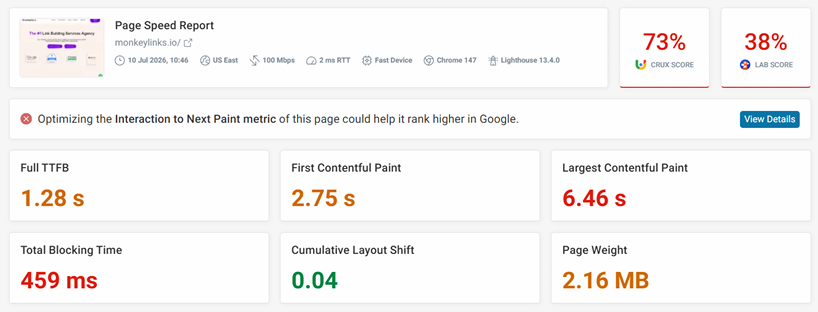
- Converted all images to WebP and compressed them — this alone brought page weight down noticeably
- Preloaded the main fonts so text renders immediately instead of flashing in late
- Found that Rocket Loader had been turned on before we got involved, and it was quietly breaking parts of the page — some Elementor elements weren’t loading correctly. The client had no idea this was happening. We turned it off and let FlyingPress handle JavaScript loading properly instead
- Set proper cache rules across the site so pages load instantly instead of rebuilding on every visit
The Results
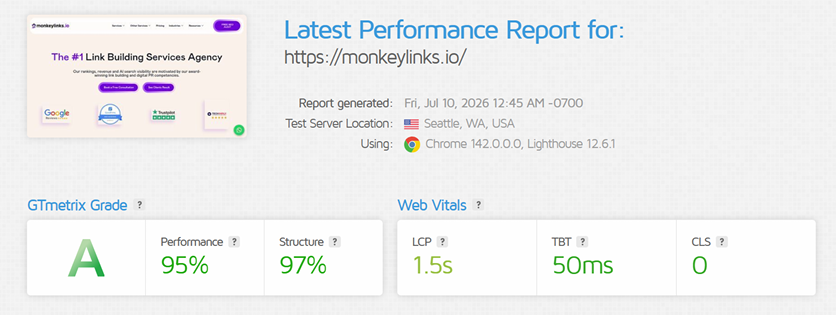
GTmetrix — Homepage
| Metric | Before | After |
|---|---|---|
| Grade | D | A |
| Performance Score | 43% | 95% |
| Structure Score | 88% | 97% |
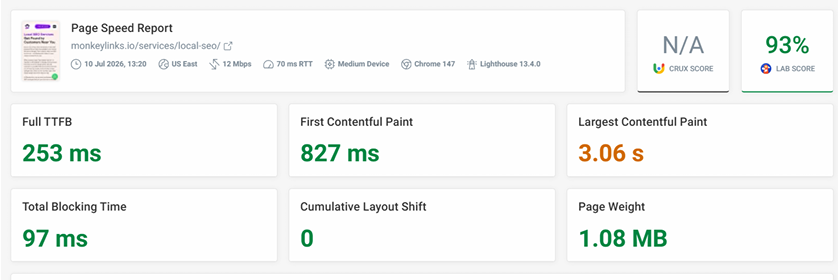
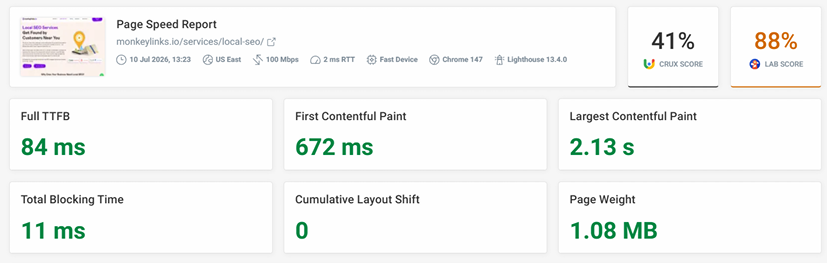
| LCP (Largest Contentful Paint) | 4.9s | 1.5s |
| TBT (Total Blocking Time) | 365ms | 50ms |
| CLS (Cumulative Layout Shift) | 0.02 | 0 |
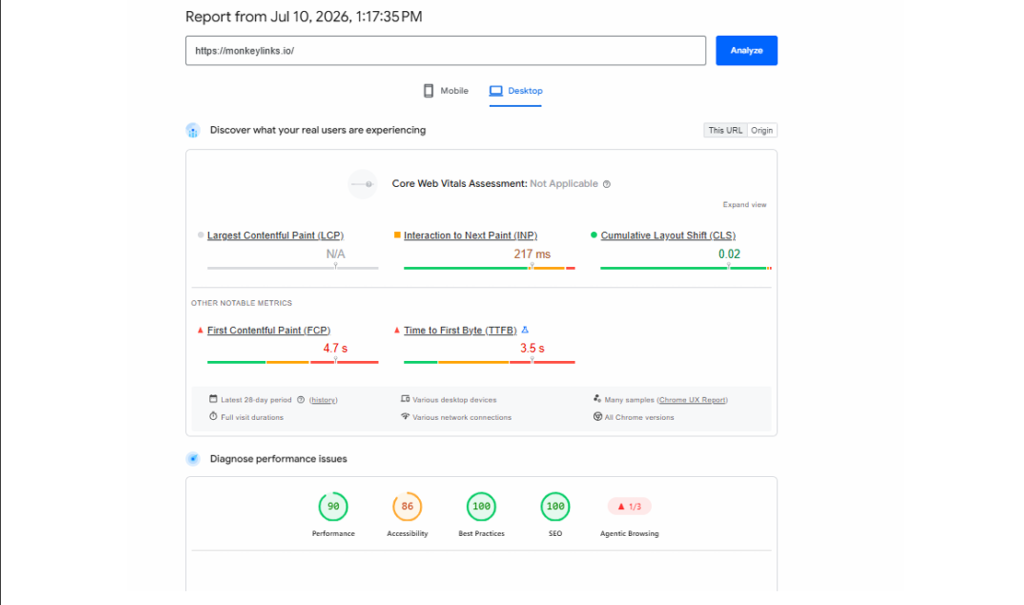
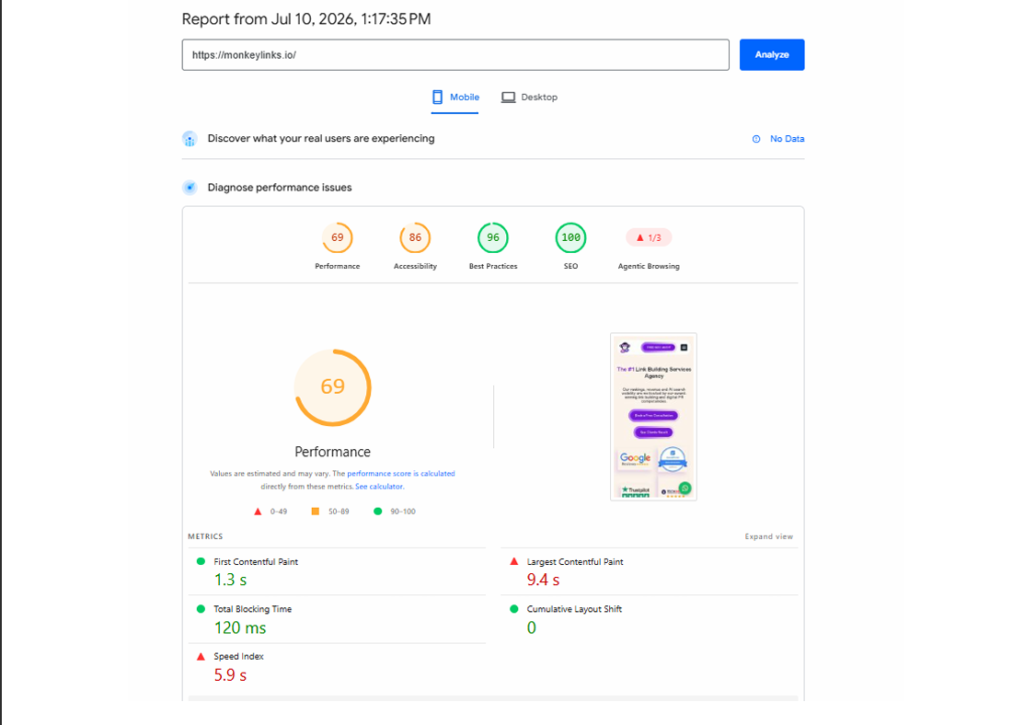
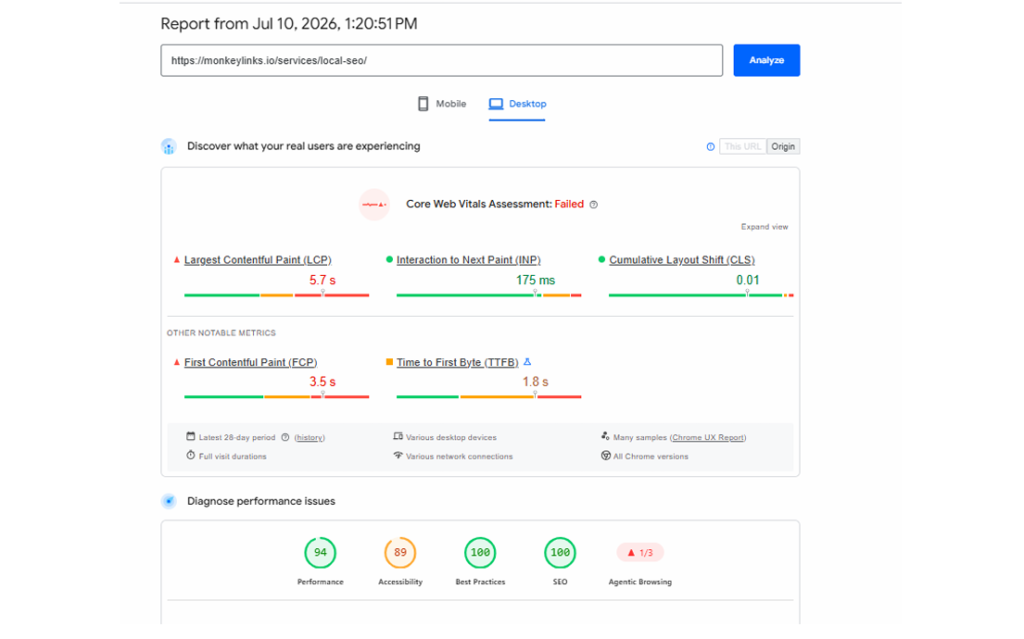
Google PageSpeed Insights — Performance Score
| Device | Before | After |
|---|---|---|
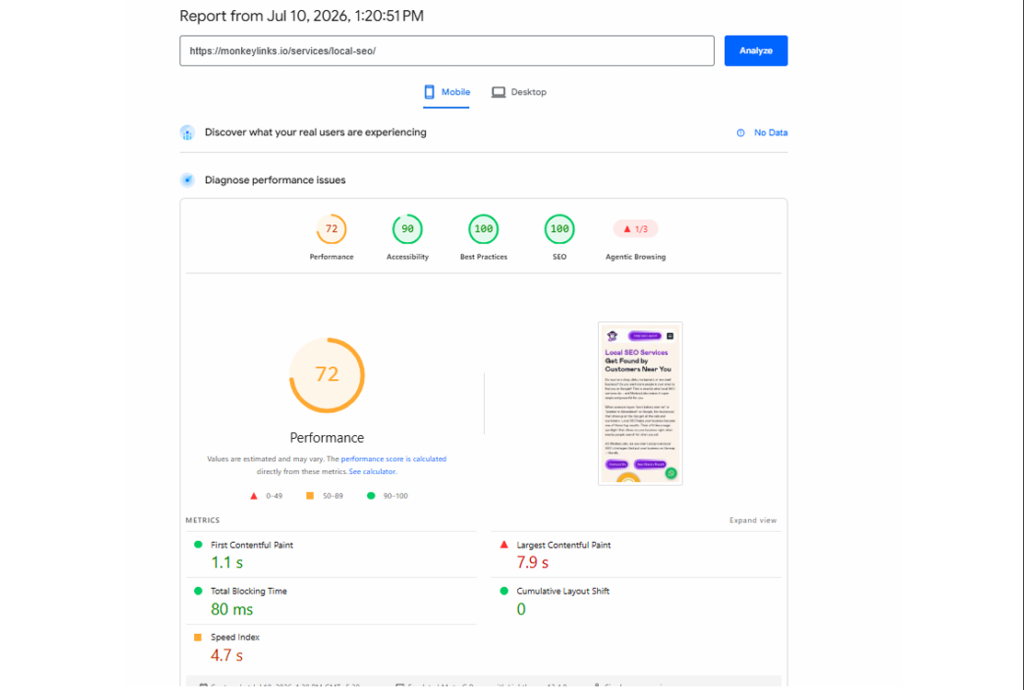
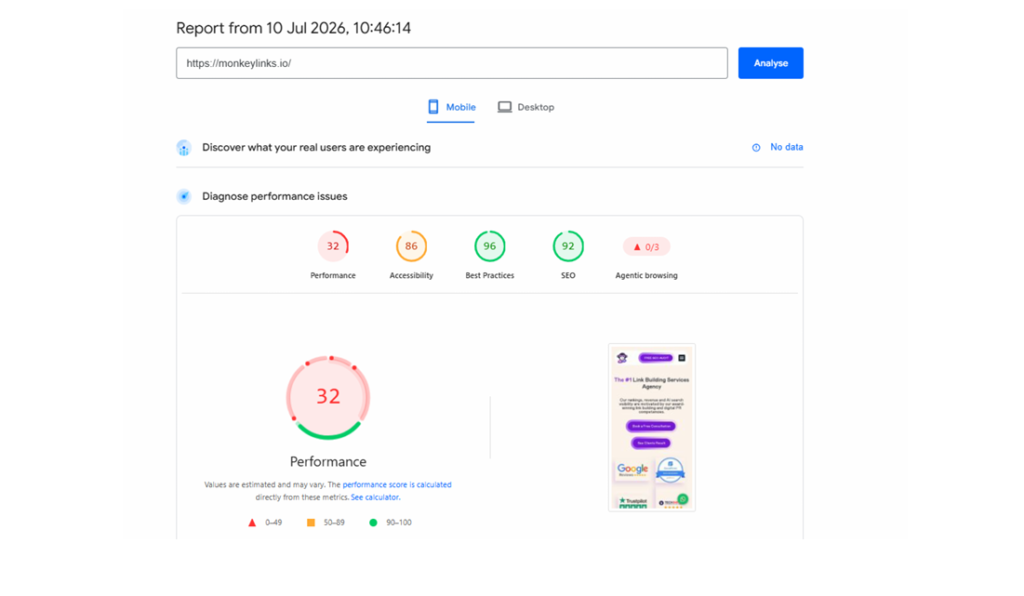
| Mobile | 32 | 69 |
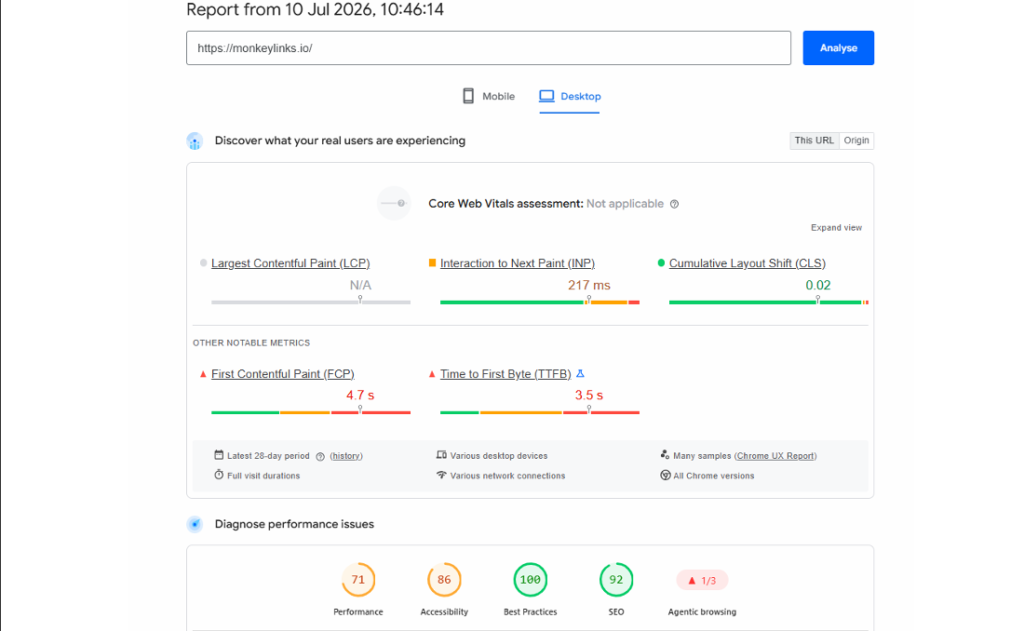
| Desktop | 71 | 90 |
Every number above is pulled directly from GTmetrix and Google PageSpeed Insights reports, taken before and after the work — nothing estimated, nothing rounded up.
Why This Matters
A slow site loses visitors before they even see the offer, and it costs rankings too, since Google factors page experience directly into search results. Fixing this isn’t just about running one plugin — it’s about catching things like a misconfigured Rocket Loader setting that a site owner would likely never notice on their own.
This is the same process we run on every client site: find what’s actually slowing the page down, fix it properly, and prove the result with real before-and-after numbers.
Images (Before Optimization)
Images (After Optimization)